B] SECONDARY SECURITIES MARKET
Price behaviour in the secondary securities markets in 1997-98
The Indian stock markets witnessed a gradual rise in stock prices during the first half of the year 1997-98, but thereafter the various macro economic factors both at the national and international levels brought the valuations down again. On an year on year basis, the 30 stock Sensitive Index (Sensex) of The Stock Exchange, Mumbai, increased from 3360.89 on March 31, 1997 to 3892.75 on March 31, 1998, an increase of 531.86 points. Nifty, the NSEIL index comprising of fifty stocks also rose by 148.6 points to close the year at 1116.90. The broad based CRISIL 500 index, which represents 500 scrips, increased from 631.42 to 715.54.
Till the first week of August 1997, the share prices had risen gradually. The Sensex touched a three year high of 4548 on August 5, 1997. This improvement in the share prices during the current year could be attributed to certain factors like favourable budget for the year 1997-98, decline in the interest rates and therefore expectations of better corporate performance. Towards the middle of August 1997, the Sensex registered a declining trend owing to lack of the active buying support by the institutions witnessed during earlier months, fall in the value of rupee and several other uncertainties. The currency crises in the South-East Asian countries had also affected the Indian capital markets, but the impact was not severe during the year. The net FIIs inflows was negative for three consecutive months of November, December 1997 and January 1998, for the first time since they were allowed to invest in the Indian securities markets. The lowest value of Sensex for the year 1997-98 was 3209.55 recorded on January 28, 1998. The markets again showed a rising trend thereafter. The Sensex closed the financial year at 3892.75, which reflected a gain of 15.82 per cent over the last year. The year of 1997-98 however, witnessed a higher level of volatility than that noticed during the previous year as shown in the graphs. This fact is supported by the trends in co-efficients of variations estimated in respect of Sensex as well as Natex.
Figure II.1

Table II.8: Sensex Volatility
| Month |
1996-97 |
1997-98 |
| April |
4.5396
|
3.5742
|
| May |
1.5815
|
0.8541
|
| June |
2.3487
|
3.2357
|
| July |
2.6191
|
1.7434
|
| August |
2.0203
|
4.7242
|
| Sept |
2.6689
|
2.1489
|
| Oct |
2.7478
|
2.5073
|
| Nov |
3.0799
|
3.4899
|
| Dec |
4.0076
|
3.2729
|
| Jan |
3.5037
|
4.8289
|
| Feb |
2.446
|
2.617
|
| March |
3.2427
|
2.2953
|
Figure II.2
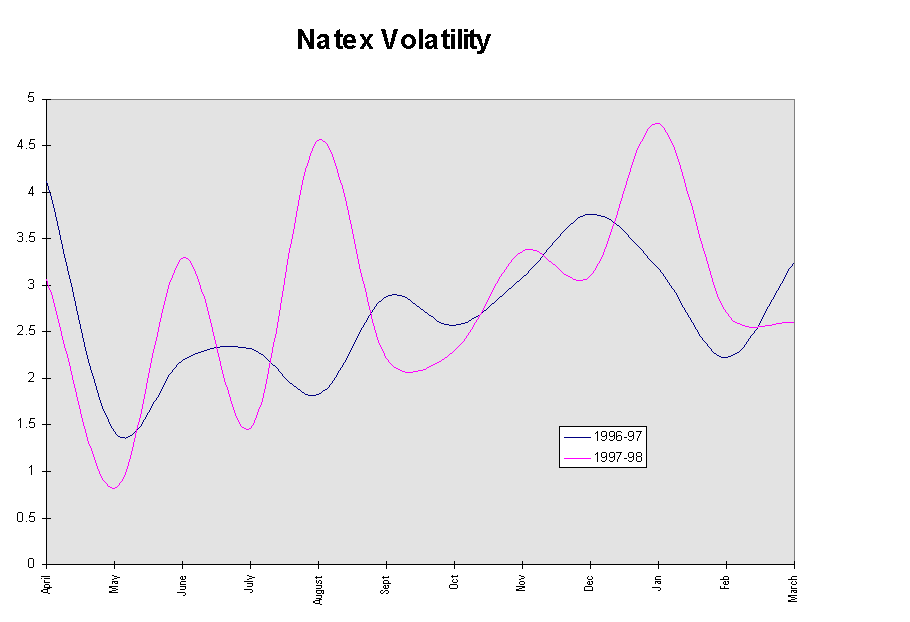
Table II.9: Natex Volatility
| Month |
1996-97 |
1997-98 |
| April |
4.116162
|
3.063102
|
| May |
1.427169
|
0.811302
|
| June |
2.18847
|
3.290953
|
| July |
2.317295
|
1.46303
|
| August |
1.823449
|
4.559486
|
| Sept |
2.875361
|
2.212841
|
| Oct |
2.560181
|
2.297917
|
| Nov |
3.078706
|
3.366107
|
| Dec |
3.766778
|
3.103357
|
| Jan |
3.179628
|
4.735744
|
| Feb |
2.22001
|
2.703297
|
| March |
3.245003
|
2.597651
|
Table II.10 below gives details of movement in equity Indices in 1997-98.
Table II.10 : Movement of various share indices
| Index |
31-03-97 |
31-03-98 |
Inc./Dec |
per cent Variation |
| BSE Sensex |
3360.89
|
3892.75
|
531.86
|
15.82
|
| BSE 100 |
1463.69
|
1697.14
|
233.45
|
15.95
|
| NSE 50 |
968.3
|
1116.9
|
148.6
|
15.35
|
| CRISIL 500 |
631.42
|
715.54
|
84.12
|
13.32
|
| CRISIL 200 |
413.42
|
489.29
|
75.87
|
18.35
|
| BSE Dollex |
151.9
|
158.75
|
6.85
|
4.51
|
Source : BSE, NSEIL and CRISIL
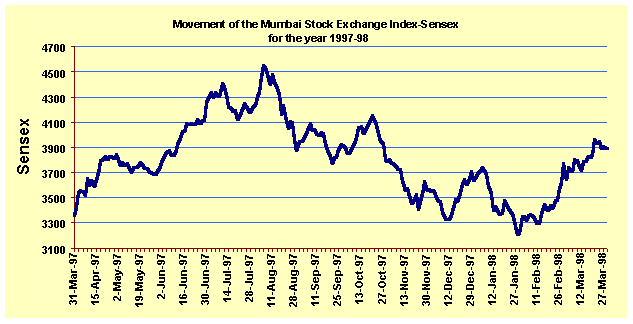
The figure II.3 below plots the movements in the daily closing level of the BSE Sensex for 1997-98.
Figure II.3
Volume of business on the stock exchanges
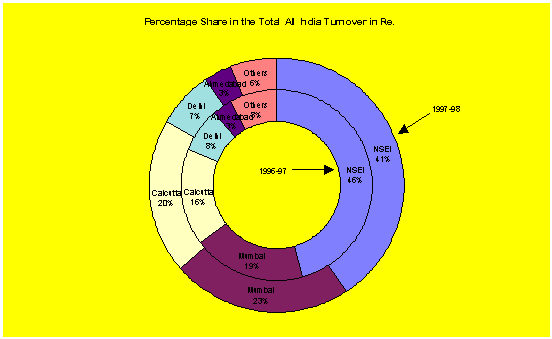
The turnover on the stock exchanges increased significantly during 1997-98. Indeed the turnover has been showing increasing trend for the last two consecutive years. This increase in turnover was facilitated and supported by the screen based trading systems and expansion of BOLT facility across the country. In 1997-98, the total single sided turnover on the stock exchanges in India was Rs. 9,08,691 crore, compared to Rs. 6,46,116 crore in 1996-97 and
Rs 2,27,368 in 1995-96. Table II.11 below gives details of the turnover on stock exchanges. The combined share of the National Stock Exchange of India Ltd, The Stock Exchange Mumbai, Calcutta Stock Exchange, Delhi Stock Exchange and Ahmedabad Stock Exchange further rose from 87.61 per cent in 1995-96 to 91.87 per cent in 1996-97 and to 94 per cent in 1997-98. This reflected a fall in business of the smaller stock exchanges.
Table II.11: Turnover on Stock Exchanges in India
|
Stock Exchanges |
Turnover (Rs. Crore) |
Percentage of total all India Turnover |
|
|
1996-97
|
1997-98
|
1996-97 |
1997-98 |
| 1 |
NSEIL |
2,94,504
|
3,69,934
|
45.58 |
40.71 |
| 2 |
Mumbai |
1,24,284
|
2,07,383
|
19.24 |
22.82 |
| 3 |
Calcutta |
1,05,664
|
1,78,778
|
16.35 |
19.67 |
| 4 |
Delhi |
48,631
|
67,840
|
7.53 |
7.47 |
| 5 |
Ahmedabad |
20,533
|
30,771
|
3.18 |
3.39 |
| 6 |
Uttar Pradesh |
16,070
|
15,390
|
2.49 |
1.69 |
| 7 |
Pune |
9,903
|
8,624.
|
1.53 |
0.95 |
| 8 |
Ludhiana |
5,274
|
8,315
|
0.82 |
0.92 |
| 9 |
Bangalore |
4,398
|
8,636
|
0.68 |
0.95 |
| 10 |
Vadodara |
4,268
|
4,576
|
0.66 |
0.50 |
| 11 |
Magadh |
2,755
|
323
|
0.43 |
0.04 |
| 12 |
Coimbatore |
2,398
|
2,136
|
0.37 |
0.24 |
| 13 |
Madras |
2,315
|
1,228
|
0.36 |
0.14 |
| 14 |
Jaipur |
1,519
|
431
|
0.24 |
0.05 |
| 15 |
Cochin |
1,401
|
1,783
|
0.22 |
0.20 |
| 16 |
Guwahati |
484
|
20
|
0.07 |
0.20 |
| 17 |
Hyderabad |
480
|
1860
|
0.07 |
0.00 |
| 18 |
SKSE |
398
|
17
|
0.06 |
0.00 |
| 19 |
Mangalore |
373
|
308
|
0.06 |
0.03 |
| 20 |
Bhubaneshwar |
231
|
202
|
0.04 |
0.02 |
| 21 |
OTCEI |
221
|
125
|
0.03 |
0.01 |
| 22 |
MP |
12
|
1
|
0.00 |
0.00 |
|
Total |
6,46,116
|
9,08,691
|
100.00 |
100.00 |
Source: SEBI
Figure II.4
Delivery patterns in the stock exchanges
The following table II.12 provides the values of shares delivered in the equity segment of stock exchanges during the year 1997-98. As it was observed, NSEIL and BSE itself account for 94.46 per cent of the total delivery in rupee value terms and 91.85 per cent in number of shares terms. However, delivery at NSEIL and The Stock Exchange, Mumbai compared to their own turnover was 15.97 per cent and 12.73 per cent in value terms and 16.08 per cent and 28.09 per cent in terms of number of shares.
Table II.12 : Delivery Patterns In Different Stock Exchanges During 1997-98
| Name
|
Turnover in Rs. Crore |
Delivery in Rs. Crore |
Delivery in per cent |
Turnover in number of shares (lakhs) |
Delivery in number of shares (lakhs) |
Delivery in per cent |
| NSEIL |
369933.99
|
59091.18
|
15.97
|
135231.52
|
21745.80
|
16.08
|
| Mumbai |
207383.22
|
26399.79
|
12.73
|
85877.00
|
24125.00
|
28.09
|
| Calcutta |
178778.82
|
1954.58
|
1.09
|
50798.00
|
1527.00
|
3.01
|
| Delhi |
67840.00
|
760.00
|
1.12
|
21243.00
|
1027.00
|
4.83
|
| Ahmedabad |
30771.00
|
277.33
|
0.90
|
12373.27
|
226.01
|
1.83
|
| Uttar Pradesh |
15390.14
|
201.80
|
1.31
|
7063.00
|
119.48
|
1.69
|
| Pune |
8624.27
|
142.04
|
1.65
|
3156.71
|
39.63
|
1.26
|
| Ludhiana |
8315.60
|
78.57
|
0.94
|
3283.00
|
102.48
|
3.12
|
| Bangalore |
8636.98
|
143.75
|
1.66
|
2356.00
|
89.85
|
3.81
|
| Vadodara |
4576.82
|
76.52
|
1.67
|
1788.00
|
59.00
|
3.30
|
| Magadh |
323.76
|
0.64
|
0.20
|
2.01
|
0.23
|
11.44
|
| Coimbatore |
2136.89
|
12.24
|
0.57
|
759.00
|
10.56
|
1.39
|
| Madras |
1228.30
|
1185.19
|
96.49
|
552.49
|
513.35
|
92.92
|
| Jaipur |
431.39
|
10.68
|
2.48
|
139.93
|
5.87
|
4.19
|
| Cochin |
1783.86
|
49.35
|
2.76
|
1213.61
|
52.63
|
4.33
|
| Hyderabad |
1860.00
|
75.16
|
4.04
|
737.00
|
130.00
|
17.64
|
| Guwahati |
20.57
|
1.65
|
8.02
|
9.67
|
1.11
|
11.48
|
| SKSE |
17.51
|
1.19
|
6.80
|
8.00
|
2.00
|
25.00
|
| Mangalore |
308.81
|
8.72
|
2.82
|
107.58
|
7.75
|
7.20
|
| Bubaneshwar |
202.49
|
2.25
|
1.11
|
94.16
|
5.90
|
6.27
|
| OTCEI |
125.44
|
29.05
|
23.16
|
191.56
|
149.63
|
78.11
|
| MP |
1.31
|
0.05
|
3.82
|
7.08
|
0.50
|
7.06
|
| Total |
908691.17
|
90501.73
|
9.96
|
326991.59
|
49940.78
|
15.27
|
Source: Various stock exchanges
A positive development in the operations of stock market has seen the decline in the ratio of bad deliveries to net deliveries. The measures taken by the SEBI through the issue of guidelines for good/bad deliveries and setting of bad delivery cells at the stock exchanges have contributed to the improvement of the system. It would be observed from the data given in table II.13 below that since October 1997 the ratio of bad deliveries has declined.
Table II.13: Data on Ratio of Bad Deliveries to Net Deliveries at NSEIL
| Month |
1995 |
1996 |
1997 |
1998 |
| January |
NA |
0.52 |
0.31 |
0.2 |
| February |
NA |
0.48 |
0.34 |
0.21 |
| March |
NA |
0.35 |
0.41 |
0.20 |
| April |
0.47 |
0.44 |
0.34 |
0.28 |
| May |
0.20 |
0.38 |
0.39 |
0.26 |
| June |
0.38 |
0.53 |
0.41 |
|
| July |
0.34 |
0.49 |
0.41 |
|
| August |
0.49 |
0.49 |
0.41 |
|
| September |
0.57 |
0.42 |
0.42 |
|
| October |
0.40 |
0.35 |
0.32 |
|
| November |
0.53 |
0.35 |
0.30 |
|
| December |
0.52 |
0.28 |
0.23 |
|
Source: NSEIL
Listed companies and market capitalisation
As on March 31, 1998, 9,833 companies were listed on stock exchanges in India, compared to 9,890 companies listed at the end of 1996-97 (Table II. 14) . The total market capitalisation of all companies listed on The Stock Exchange, Mumbai ( there were 5853 companies listed on BSE as on March 31, 1998) was Rs. 5,60,325 crore as on March 31, 1998 indicating a rise of 20.78 per cent from its 1996-97 level of Rs. 4,63,915 crore.
Figure II.5
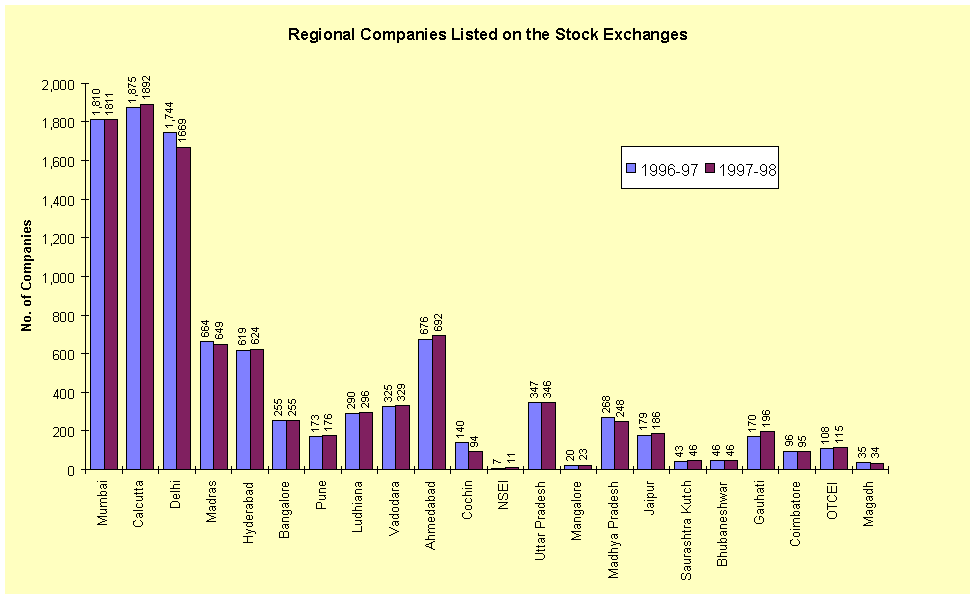
Table II.14 : Regional Companies Listed on Stock Exchanges in India
| No. |
Stock Exchanges |
Regional Companies Listed |
|
|
1996-97
|
1997-98
|
|
1
|
Mumbai |
1,810
|
1811
|
|
2
|
Calcutta |
1,875
|
1892
|
|
3
|
Delhi |
1,744
|
1669
|
|
4
|
Madras |
664
|
649
|
|
5
|
Hyderabad |
619
|
624
|
|
6
|
Bangalore |
255
|
255
|
|
7
|
Pune |
173
|
176
|
|
8
|
Ludhiana |
290
|
296
|
|
9
|
Vadodara |
325
|
329
|
|
10
|
Ahmedabad |
676
|
692
|
|
11
|
Cochin |
140
|
94
|
|
12
|
NSEI |
7
|
11
|
|
13
|
Uttar Pradesh |
347
|
346
|
|
14
|
Mangalore |
20
|
23
|
|
15
|
Madhya Pradesh |
268
|
248
|
|
16
|
Jaipur |
179
|
186
|
|
17
|
Saurashtra Kutch |
43
|
46
|
|
18
|
Bhubaneshwar |
46
|
46
|
|
19
|
Guwahati |
170
|
196
|
|
20
|
Coimbatore |
96
|
95
|
|
21
|
OTCEI |
108
|
115
|
|
22
|
Magadh |
35
|
34
|
|
Total |
9,890
|
9833
|
Source: SEBI
Trading, Clearing and Settlement of Debt Securities
At present, The Stock Exchange, Mumbai (BSE), NSEIL and The Calcutta Stock Exchange Association Limited are integrated with NSDL. BOI Share Holding Limited which acts as the clearing house for BSE and the National Securities Clearing Corporation acts as clearing corporation for NSEIL. Trades which are executed on these exchanges in dematerialised securities trading segment can be cleared by the respective clearing houses/corporations for settlement by electronic book entry within NSDL. As transfers in the case of debentures have not yet been exempted from the payment of stamp duty, settlement of debentures is not possible by electronic book entry within NSDL.