D] FOREIGN INSTITUTIONAL INVESTMENT
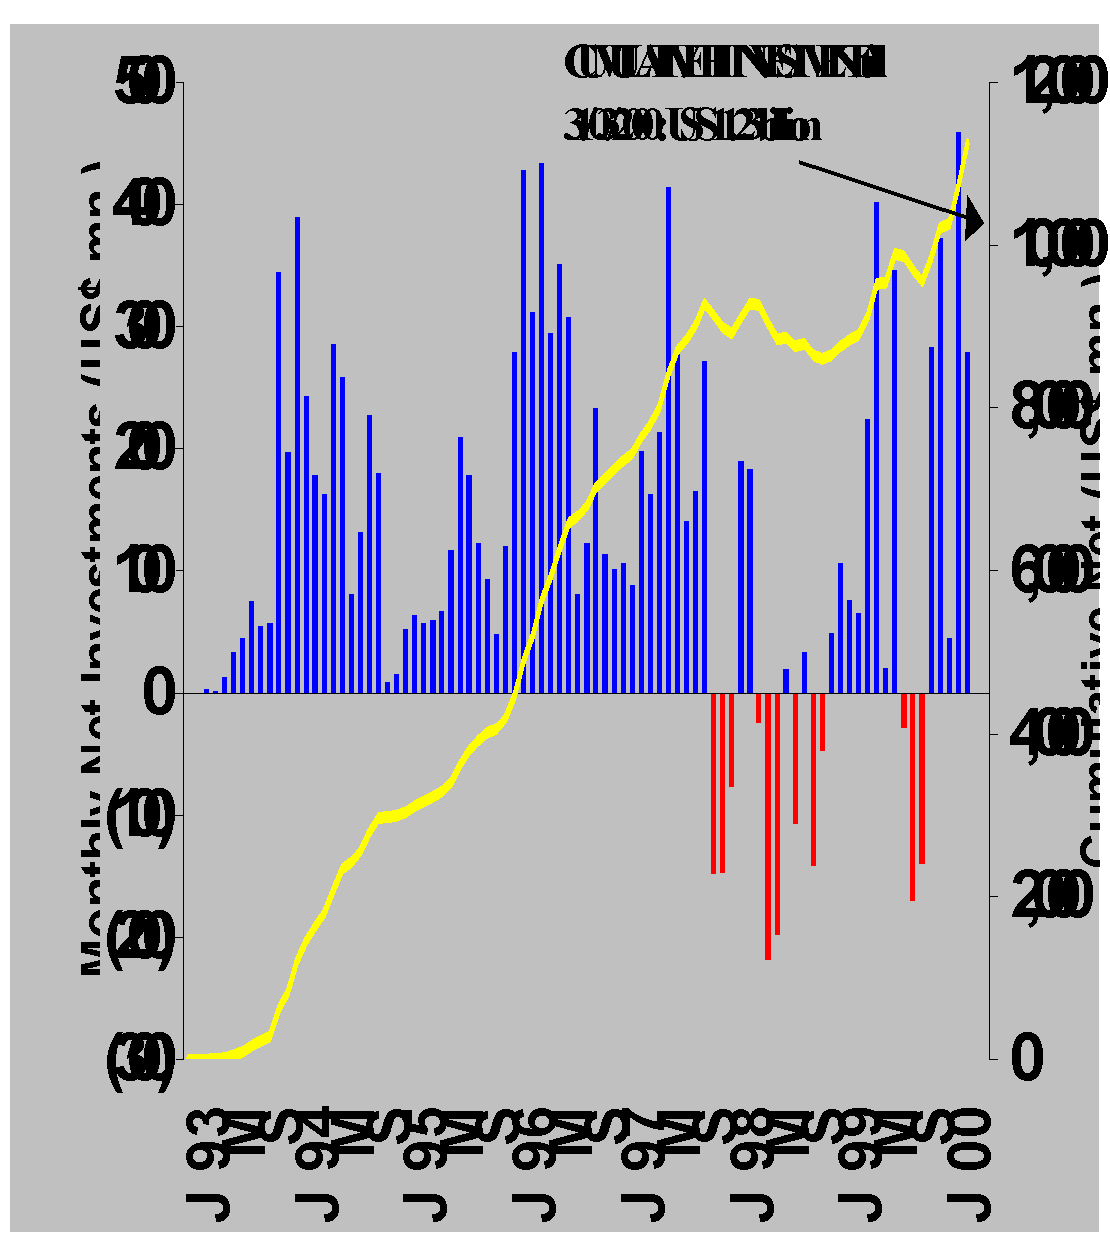
On December 8, 1999, the cumulative net investment made by the Foreign Institutional Investors (FIIs) in the Indian Capital Market since September 1992, crossed the 10 billion-dollar mark. Though there was an outflow of funds during the period August-October 1999, the underlying sentiment towards the Indian markets was bullish. During the year 1999-2000, FIIs had made a net investment of Rs. 10,121.93 crore, as compared to the outflow of Rs. 1,584.5 crore during 1998-99. Apart from market considerations, this reversal in trend is also reflective of the confidence of FIIs in the structural reforms introduced by the SEBI to make the Indian markets more investor friendly, transparent and efficient. The net investment made by the FIIs as on March 31, 2000 stood at US $11.23 billion. The yearly cumulative net investment made by the FIIs is given Table 2.40
Table: 2.40 Yearly Trends in FII Investment
| Total | Gross Purchases
Rs. Crore |
Gross Sales Rs. Cr | Net Investment
Rs. Cr |
Net Investment in US$ Million | Cumulative Net Investment US$ m at Monthly Exchange Rate |
| 1992-93 |
17.4
|
4.0
|
13.4
|
4.2
|
4.2
|
| 1993-94 |
5,592.5
|
466.3
|
5,126.2
|
1,634.0
|
1,638.3
|
| 1994-95 |
7,631.0
|
2,834.8
|
4,796.3
|
1,528.3
|
3,166.6
|
| 1995-96 |
9,693.5
|
2,751.6
|
6,942.0
|
2,035.7
|
5,202.3
|
| 1996-97 |
15,553.9
|
6,979.4
|
8,574.5
|
2,431.9
|
7,634.2
|
| 1997-98 |
18,694.7
|
12,737.2
|
5,957.4
|
1,650.1
|
9,284.3
|
| 1998-99 |
16,115.0
|
17,699.4
|
(1,584.4)
|
(386.1)
|
8,898.2
|
| 1999-00 |
56,855.5
|
46,733.5
|
10,121.9
|
2,339.1
|
11,237.3
|
| Total |
1,30,153.4
|
90,206.2
|
39,947.3
|
||
| Figures in bracket are not outflows.
Figures may not add exactly due to rounding. Source: SEBI |
|||||
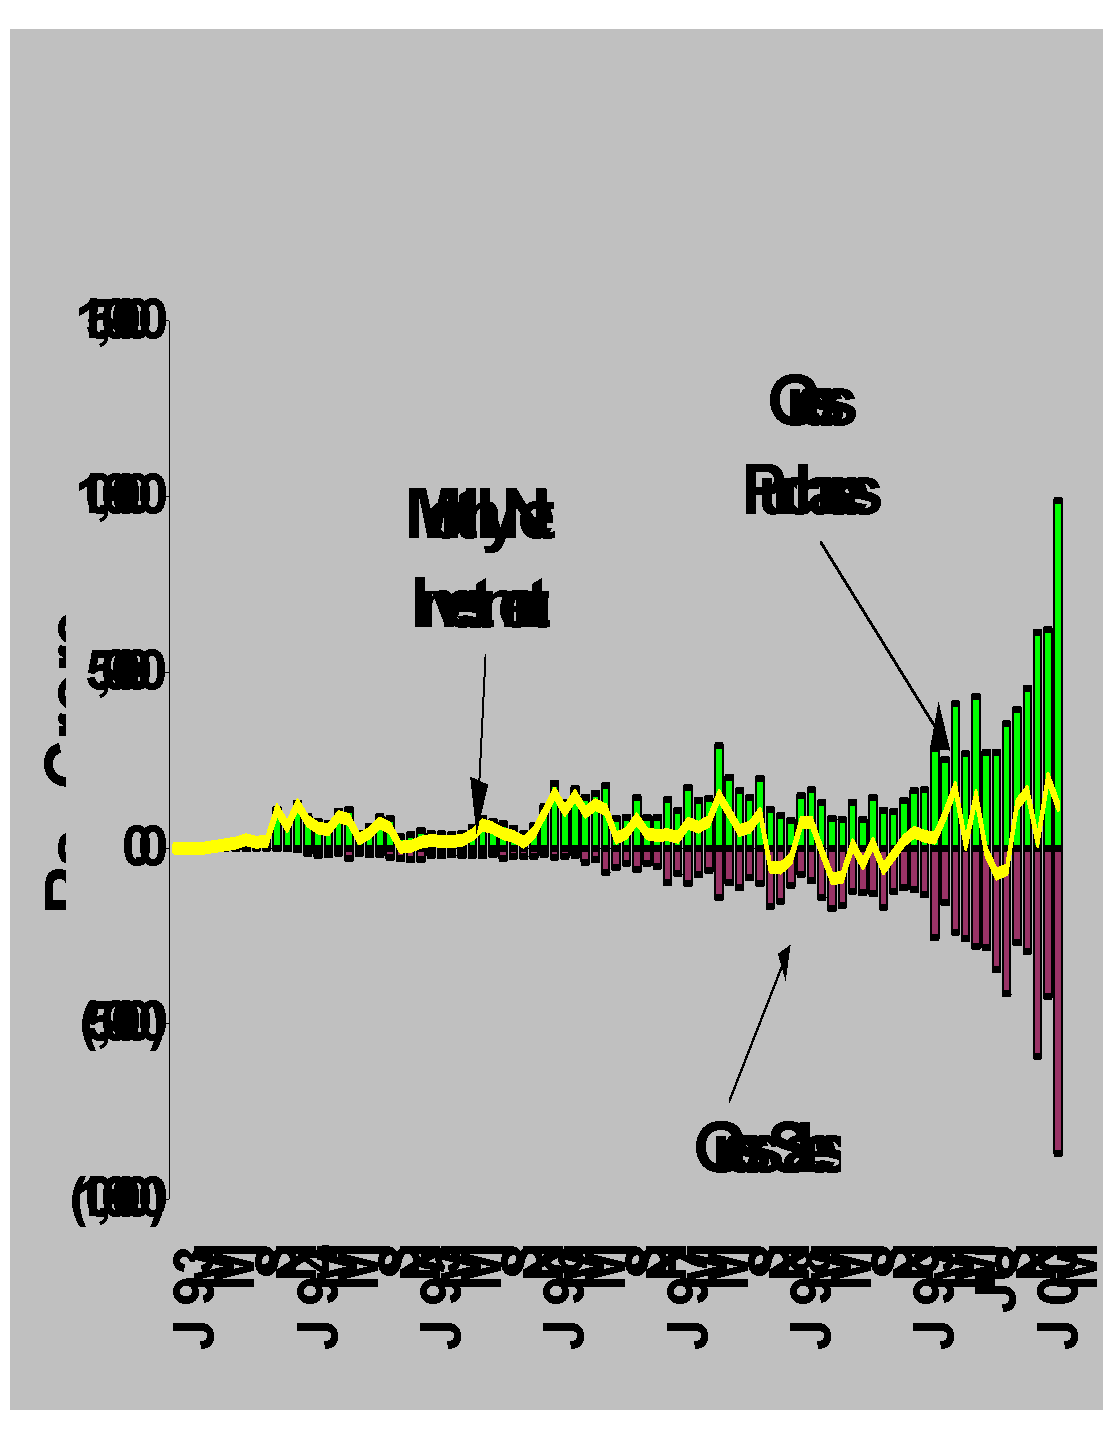
Another noteworthy feature is the increase in the FII turnover at the exchanges as compared to previous years. The gross purchases and sales by the FIIs during the year 1999-2000 were Rs. 56,855.46 crore (Rs.16,115 crore)* and Rs. 46,733.52 crore (Rs. 17,699.4 crore)*. This is reflective of the increasing depth of the Indian markets.

Graph 2.20 : Monthly investment trends since 1993
A detailed break up of monthly trend in investments during 1999-2000 is furnished in Table 2.41.
Table: 2.41 :Monthly Trends in FII Investment
| Month |
Gross Purchases Rs. Cr
|
Gross Sales Rs. Cr
|
Net Investment Rs. Cr
|
Net Investment US$ Million at Monthly Exchange Rate
|
Cumulative Net Investment US$ Million at Monthly Exchange Rate
|
| 1999-2000 | |||||
| A 99 |
2,519.32
|
1,565.83
|
953.49
|
223.17
|
9,121.41
|
| M 99 |
4,108.29
|
2,388.99
|
1,719.30
|
401.98
|
9,523.39
|
| J 99 |
2,669.96
|
2,581.32
|
88.64
|
20.55
|
9,543.94
|
| JL 99 |
4,310.74
|
2,807.01
|
1,503.73
|
348.61
|
9,892.54
|
| A 99 |
2,714.13
|
2,836.08
|
(121.95)
|
(28.06)
|
9,864.48
|
| S 99 |
2,725.63
|
3,466.01
|
(740.38)
|
(170.08)
|
9,694.40
|
| O 99 |
3,535.35
|
4,142.40
|
(607.05)
|
(139.71)
|
9,554.69
|
| N 99 |
3,934.47
|
2,705.44
|
1,229.03
|
283.19
|
9,837.87
|
| D 99 |
4,556.19
|
2,938.57
|
1,617.62
|
372.04
|
10,209.91
|
| J 00 |
6,129.73
|
5,933.16
|
196.57
|
45.14
|
10,255.05
|
| F 00 |
9,761.57
|
6,677.47
|
3,084.10
|
707.20
|
10,962.25
|
| M 00 |
9,890.07
|
8,691.24
|
1,198.83
|
275.02
|
11,237.27
|
| Total |
56,855.46
|
46,733.52
|
10,121.93
|
2,339.03
|
|
| Figures may not add exactly due to rounding.
Source: SEBI |
|||||
The increase in the gross FII purchases and sales since January 1993 has been shown in the Graph 2.21

Graph 2.21: Monthly trends in Purchases and sales by FIIs
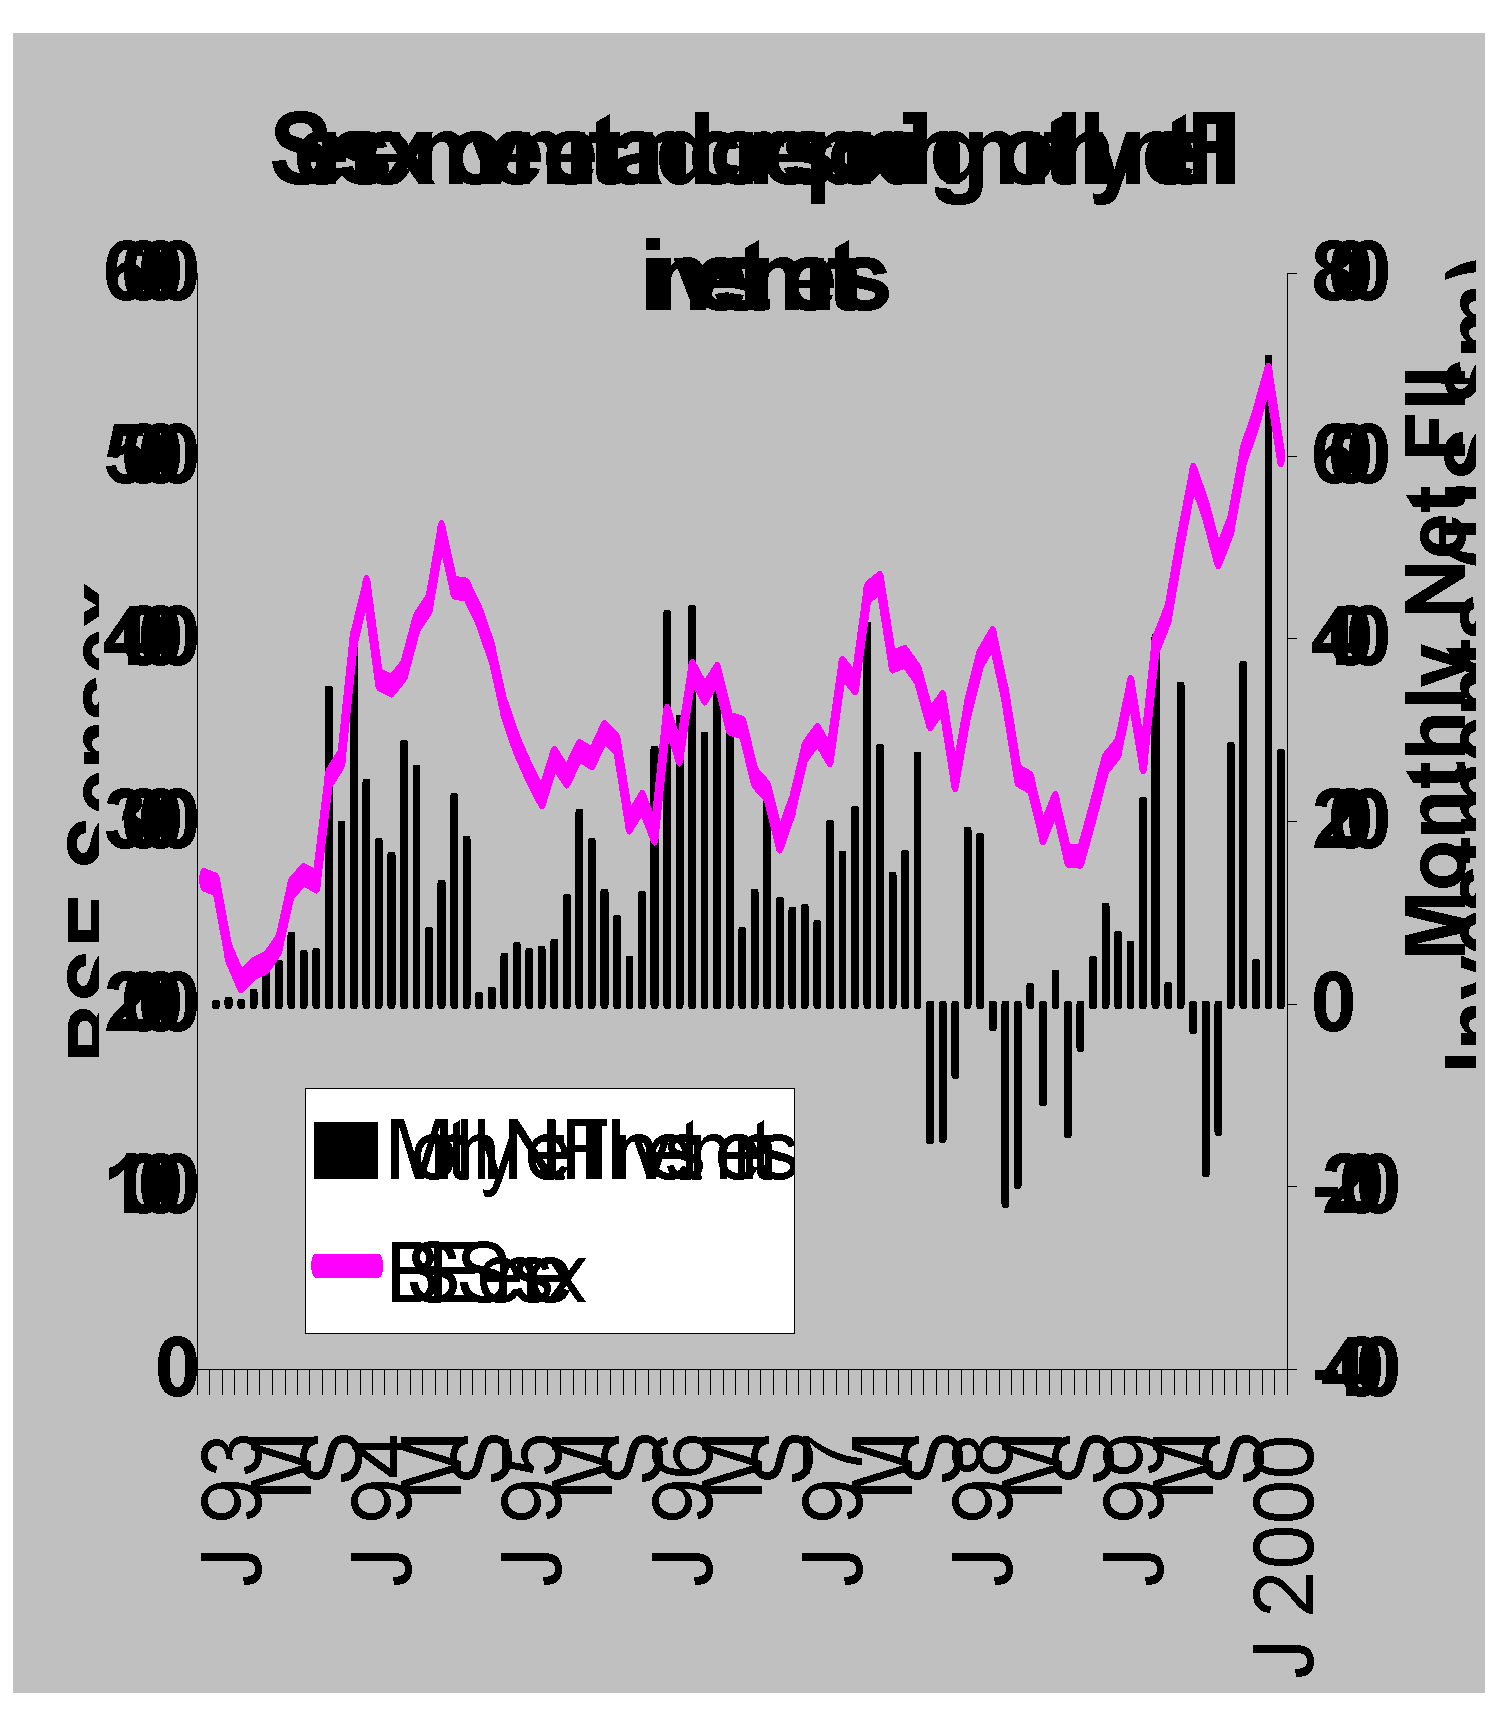
During the year (1999-2000) 56 FIIs were registered. As on March 31, 2000, 506 FIIs were registered with SEBI.The Asian financial crisis did have an impact in the FII investment in 1998-99 but the low volatility of the Indian markets as compared to other emerging market economies and an efficient market structure were some of the factors responsible for continued confidence of FIIs in Indian capital market. The figure below exhibits the movement of the BSE Sensex and the corresponding FII monthly net investment.
Graph 2.22: Sensex Movement and corresponding monthly net FII investments

The South East Asian crisis of 1997-98 had resulted in a review of investment strategy by the global investors in respect of emerging market economies. However, the Indian markets bucked the trend and gained considerably from April 1, 1998 to March 31, 2000. Low volatility, attractive valuations and a stable currency were some of the factors which led to surge in the FIIs investment.